
Quick take
- Separate activity types before turning volume into estimated effort.
- Use productive service hours, not payroll hours, as the capacity input.
- A target below 100 percent leaves room for variability and work outside the model.
- The output is a planning indicator, not exact staffing demand or employee performance.
A weekly dashboard says the service desk handled 273 activities. The number feels substantial, but it leaves the planning question unanswered. Were most contacts quick answers? How many hours were actually reserved for this service? Was the week complete? A count has no denominator.
Capacity planning creates that denominator. The simplest useful model converts activity volume into estimated minutes, converts scheduled service availability into target minutes, and compares the two. Every assumption remains visible.
Why volume is not utilization
Two service desks can each process 250 requests and carry very different workloads. One may handle access questions with a narrow scope. The other may prepare devices and restore meeting-room systems. Average category effort changes the meaning of the count.
Headcount is just as easy to misuse. Three full-time analysts are not automatically three full-time units of desk capacity. Projects, documentation, training, meetings, on-call duties and other work consume scheduled hours. PTO, illness and skill coverage change what can actually be planned for the service channel.
The inputs a simple model needs
Activity volume
Use stable categories over a defined day or week. Ticket records can be part of the set. Add separate activity capture only where relevant work occurs outside the ticket path.
Standard minutes
Assign a reasonable planning value to each category. This is an estimate of typical effort, not a timer and not a performance quota.
Productive service capacity
Count the hours intentionally available for the work being modeled. Do not start with total paid hours unless the entire job is in scope.
Target utilization
Reserve some capacity for handoffs, variability, clarification and demand the category model misses. The right target belongs to the operating context. The 75 percent used below is example data, not a universal benchmark.
Use formulas people can audit
Estimated effort = activity count × standard minutesRaw capacity = planned staff × productive hours × 60Target capacity = raw capacity × target utilizationCalculated utilization = estimated minutes ÷ target capacity × 100Simple math is a strength when the inputs are honest. It becomes a weakness when a polished percentage hides stale standard times, incomplete capture or capacity hours that were never truly available.
Worked weekly example
Step 1: Convert activity mix into planning minutes
| Activity | Count | Standard minutes | Estimated effort |
|---|---|---|---|
| Quick user questions | 140 | 4 | 560 minutes |
| Device handoffs | 45 | 8 | 360 minutes |
| Access assistance | 40 | 6 | 240 minutes |
| Meeting-room assists | 18 | 15 | 270 minutes |
| Equipment returns | 30 | 6 | 180 minutes |
| Total | 273 | – | 1,610 minutes = 26 hours 50 minutes |
Step 2: Build target capacity
Three analysts are each scheduled for 16 productive service hours during the week. The model uses a 75 percent target utilization.
Raw capacity = 3 × 16 × 60 = 2,880 minutesTarget capacity = 2,880 × 0.75 = 2,160 minutesStep 3: Compare estimated demand with target capacity
1,610 ÷ 2,160 × 100 = 74.5%This percentage means the estimated activity load uses 74.5 percent of the model’s target capacity. It does not mean three people spent 74.5 percent of their paid week actively handling requests.
A staffing value is still a model output
The same inputs can express demand in capacity units. One analyst scheduled for 16 productive service hours at a 75 percent target contributes 720 target minutes. Dividing 1,610 estimated minutes by 720 produces 2.24 calculated capacity units.
1,610 ÷ (16 × 60 × 0.75) = 2.24 capacity unitsThat figure is not a hiring instruction or an exact headcount. Shift coverage, minimum staffing, skills, absence and real queue behavior may require a different answer. Treat it as an auditable starting point for a planning discussion.
Do not turn a planning model into a verdict
The calculation does not automatically understand:
- PTO, illness, holidays or training
- skill and authorization coverage
- waiting for users, vendors or approvals
- projects, parallel work and on-call responsibilities
- wide differences in actual handling time
- missing days, duplicate capture or category changes
High-volume real-time voice or chat queues with service-level commitments may require interval forecasts and queueing models. ServiceNow’s demand forecast documentation, for example, describes forecasts at 15-, 30- and 60-minute intervals based on historical contact volumes. The weekly model here serves a different purpose: a transparent first view of recurring operational demand.
Use time ranges that match the decision
Daily values reveal spikes but can overreact to one outage. Weekly totals are steadier. A rolling four-week average helps separate a one-off event from a developing pattern. Seasonal services may need year-over-year context.
Show data completeness beside every trend. Was the capture station used on all open days? Did an outage interrupt recording? Did the category set change? A blank day should never silently become “lower demand.”
Team planning does not require named activity records
A team-level calculation can use total counts, categories, standard minutes and aggregate capacity. There is no technical need to assign every tap to an employee. That keeps the planning question focused on the service point.
Individual working-hour profiles may help when schedules differ substantially. They should be used for a defined capacity purpose, not to manufacture performance rankings from estimated minutes. Access, retention and purpose need an organizational decision before named capture is enabled.
Capacity reporting in CountPilot
CountPilot combines recurring activity counts with configured standard minutes. Staffing assumptions, productive hours, shift models and target utilization can receive effective dates. Reports can show daily and weekly totals, previous-week comparisons, rolling four-week averages and capture completeness.
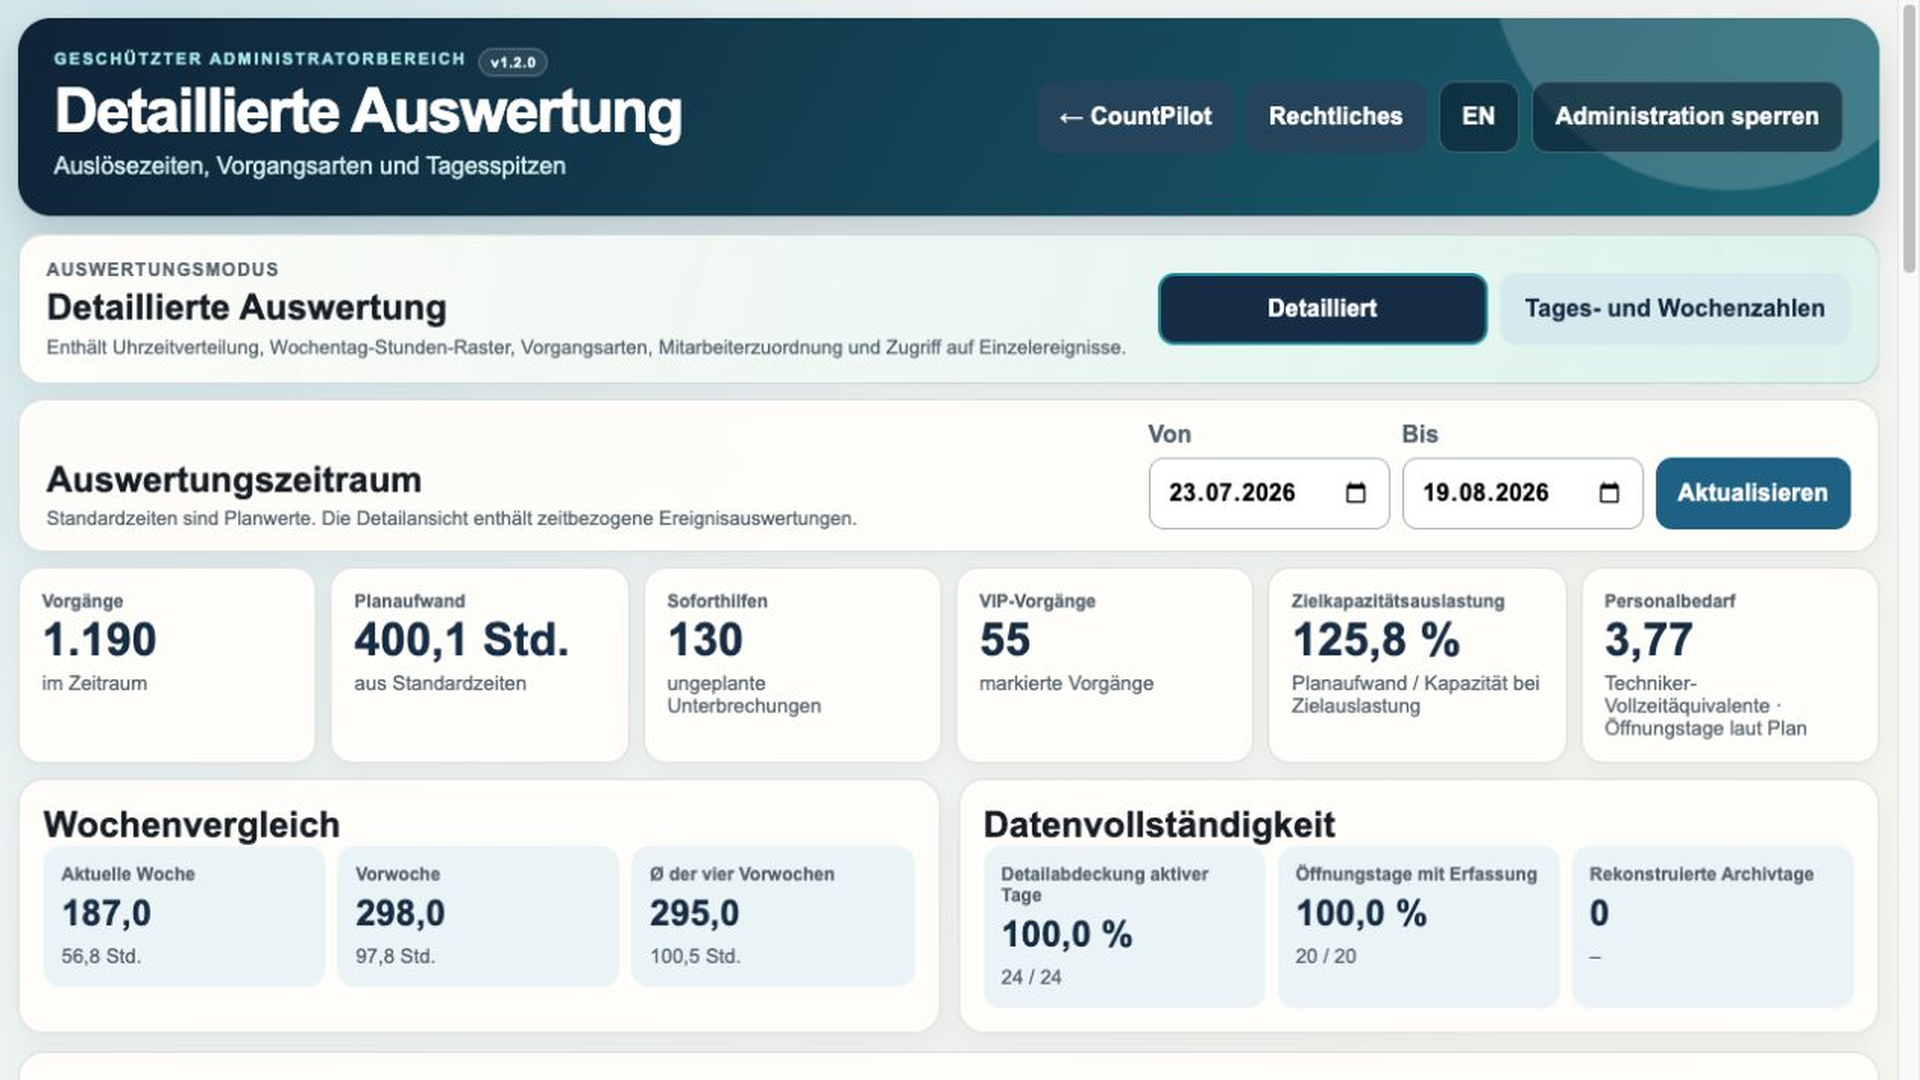
Where historical daily totals lack the original event-level standard time, reconstructed rows are labeled as using the current standard time. Mixed standard-time periods should also remain visible. That distinction keeps a later configuration change from masquerading as an old observed fact.
Before any capacity model, decide which support work belongs in the activity set. The use-case overview shows how the same capture method can fit different service points.
Frequently asked questions
How do you calculate service desk utilization?
A simple model divides estimated workload minutes by target capacity minutes for the same period and service scope.
What data do we need?
Activity counts, standard minutes, planned productive hours, staffing level and a justified target utilization. Capture completeness and unusual events belong beside the result.
How long should we collect data?
Several comparable weeks are more useful than a single day. Seasonal staffing decisions require longer series and operating context.
Are standard minutes actual labor time?
No. They are planning assumptions for an activity type and must not be presented as measured handling time.
Can the model produce exact staffing requirements?
No. It produces a calculated planning value. Absence, skills, waiting, queue behavior and work outside the model still matter.
Further reading
- ServiceNow: Demand Forecast – an official example of interval-based contact-volume and staffing forecasts.
- Atlassian: View team capacity in Workforce Management – capacity in the context of assigned work.
Related guides
TEST YOUR ASSUMPTIONS
Build a local planning view around your own service activity.
The evaluation runs for 30 days without an account, payment details or a vendor cloud.